
Since the inception of the Internet, the self-driving car stands out as one of the most significant technological advancements for society. It’s inevitable that these vehicles will soon dominate the streets.
For a self-driving car to navigate effectively, it must detect the physical objects in its vicinity. This is facilitated by a spinning LiDAR sensor Arduino installed on the vehicle’s roof, which provides a detailed, three-dimensional view of the surrounding road.
Although LiDAR technology has been around since the early days of laser development in 1963, its high cost limited its use to government and military applications. However, recent price reductions have made LiDAR accessible even to hobbyists, with the TFMini-S emerging as a popular and affordable option.
In this tutorial, we’ll demonstrate how to connect the TFMini-S module to an Arduino for precise distance measurements. But first, let’s delve into a brief overview of LiDAR technology.
Parts Required
What is LiDAR and How does it Work?
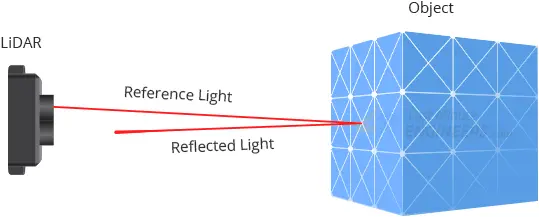
LiDAR, derived from the words “Light” and “RADAR” or, if preferred, an acronym for “Light Detection And Ranging,” functions akin to RADAR but utilizes light instead of radio waves.
Fundamentally, LiDAR operates by emitting a laser towards an object. Upon hitting the object, the laser reflects back to the sensor. By gauging the time taken for the light to return to the sensor, the distance to the object can be approximated. This distance measurement can fluctuate based on environmental factors and the object’s reflectivity.
Through the sweeping or spinning motion of a LiDAR sensor arduino, a 3D map of the surroundings can be rapidly generated. Typically, this data is represented as a “point cloud” to facilitate better comprehension of the information captured by LiDAR.

TFMini-S Hardware Overview
Manufactured by Benewake (Beijing) Co. Ltd., the TFMini-S stands out as a high-precision, single-point ToF (Time of Flight) LiDAR sensor. It serves as an excellent choice for integrating laser-based ranging with exceptional accuracy into various robotics or interactive projects.
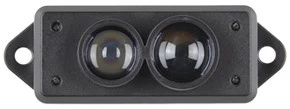
Compact in size, resembling a USB stick, the TFMini-S enables the incorporation of LiDAR into projects that previously relied on smaller sensors like the SHARP GP-series infrared rangefinders.
With the ability to measure distances from as close as 10 centimeters to as far as 12 meters, the TFMini-S offers versatility in range.
Beyond its affordability, compact dimensions, and extensive range, the TFMini-S boasts superior distance measurement accuracy. It maintains an accuracy of ±6cm up to 6m and ±1% thereafter.
Effective Detection Range
Like all LiDAR sensors, the TFMini-S’s effective detection range is influenced by lighting conditions, weather, and the reflectivity of the target object.
The graph below illustrates the TFMini-S’s operating range under different circumstances:
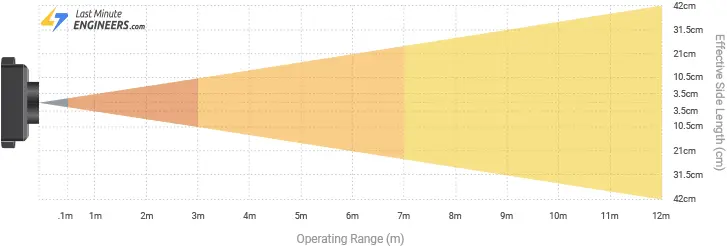
- The TFMini-S has a blind zone of 0-10cm; within this range, data reliability is compromised.
- Under extreme conditions such as outdoor glare (with an illumination intensity of approximately 100klux at noon in summer) and detection of black targets (with a reflectivity of 10%), the TFMini-S operates within a range of 0.1-3m.
- In normal sunlight conditions (with an illumination intensity of about 70klux), the TFMini-S’s operating range extends from 0.1-7m.
- In indoor environments or low ambient light conditions, the TFMini-S’s operating range spans from 0.1-12m.
Communication Interfaces
By default, the TFMini-S communicates over the UART interface, with commonly used UART RX and TX pins functioning at 115200bps.
Alternatively, you can configure the sensor to communicate over I2C by sending the appropriate commands.
Detection Frequency
According to the datasheet, the TFMini-S can perform up to 1000 measurements per second (default is 100). This frequency is adjustable by sending the relevant commands.
It’s important to note that increasing the output frequency may reduce accuracy. Thus, depending on the desired measurement accuracy, you should adjust the output frequency accordingly.
Input Power
As per the datasheet, the TFMini-S operates on 5V and consumes approximately 140 mA during acquisition, with a maximum current draw of around 200 mA.
During testing, however, the sensor was observed to draw about 70mA independently. Therefore, when using a 5V Arduino, a logic level converter, and the sensor, expect a consumption of around 100mA. For basic tests, powering the sensor via the USB port (5V/500mA) should suffice.
Keep in mind that the TFMini-S lacks overvoltage protection, so ensure power supply voltage fluctuations stay within 0.1V.
Logic Levels
While the TFMini-S can be powered at 5V, its I/O pins operate at 3.3V logic. Therefore, it’s advisable to use a logic level converter when interfacing the sensor with a 5V microcontroller.
However, if only reading the TFMini-S (in UART mode), it may not require a logic level converter.
Technical Specifications
Here are the specifications:
| Detection range | 10cm – 12m |
| Resolution | 1cm |
| Ranging Accuracy | ±6cm up to 6m and ±1% thereafter |
| Input Voltage | 5V |
| UART TTL Voltage | 3.3V |
| Current Consumption | 140mA (typ.), 800mA (peak) |
| Detection Frequency | 1 to 1000 scans per second (adjustable) |
| Light Wavelength | 850nm |
| Field of view | 2.3° |
| Communication interfaces | UART and I2C |
| Baud Rate | 115200 |
For more information about the TFMini-S LiDAR sensor arduino, please refer to the datasheet below.
TFMini-S Pinout
Let’s take a closer look at the pinout of the TFMini-S. This LiDAR sensor features four pins:
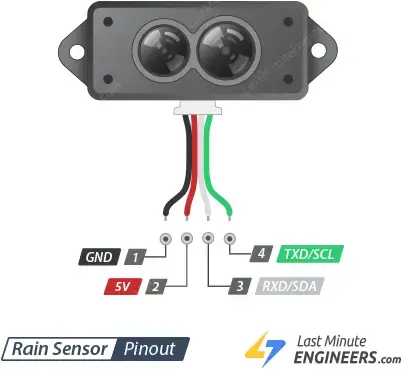
- GND: This pin serves as the Ground connection.
- VCC: Connect this pin to a 5V power supply for power input.
- RXD/SDA: This pin facilitates data transmission to the sensor (in UART communication mode) or bidirectional data transfer (in I2C communication mode). It operates at a 3.3V logic level.
- TXD/SCL: This pin either sends data from the sensor to your microcontroller (in UART communication mode) or acts as a clock signal (in I2C communication mode). It also operates at a 3.3V logic level.
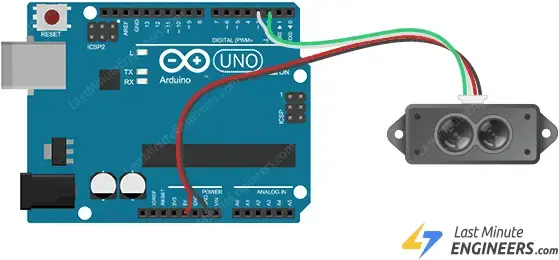
Wiring a TFMini-S Sensor to an Arduino
Hooking up a TFMini-S sensor to an Arduino is straightforward. You’ll only need to make four connections.
Start by linking the Red wire (VCC) from the TFMini-S sensor to the 5V output pin on the Arduino, and connect the Black wire (GND) to the Arduino’s GND pin.
Next, attach the White wire (RXD/SDA) from the TFMini-S sensor to digital pin 3 on the Arduino, and the Green wire (TXD/SCL) to digital pin 2. We’ll be utilizing a software UART for this setup.
Refer to the image below for guidance on assembling the circuit.
Arduino Example Code
With all the connections made, it’s time to execute a basic sketch to showcase the TFMini-S sensor’s functionalities.
#include <SoftwareSerial.h>   //header file of software serial port
SoftwareSerial Serial1(2, 3); //define software serial port name as Serial1 and define pin2 as RX & pin3 as TX

int dist;                     //actual distance measurements of LiDAR
int strength;                 //signal strength of LiDAR
int check;                    //save check value
int i;
int uart[9];                   //save data measured by LiDAR
const int HEADER = 0x59;      //frame header of data package


void setup()
{
  Serial.begin(9600);         //set bit rate of serial port connecting Arduino with computer
  Serial1.begin(115200);      //set bit rate of serial port connecting LiDAR with Arduino
}


void loop() {
  if (Serial1.available())                //check if serial port has data input
  {
    if (Serial1.read() == HEADER)        //assess data package frame header 0x59
    {
      uart[0] = HEADER;
      if (Serial1.read() == HEADER)      //assess data package frame header 0x59
      {
        uart[1] = HEADER;
        for (i = 2; i < 9; i++)         //save data in array
        {
          uart[i] = Serial1.read();
        }
        check = uart[0] + uart[1] + uart[2] + uart[3] + uart[4] + uart[5] + uart[6] + uart[7];
        if (uart[8] == (check & 0xff))        //verify the received data as per protocol
        {
          dist = uart[2] + uart[3] * 256;     //calculate distance value
          strength = uart[4] + uart[5] * 256; //calculate signal strength value
          Serial.print("distance = ");
          Serial.print(dist);                 //output measure distance value of LiDAR
          Serial.print('\t');
          Serial.print("strength = ");
          Serial.print(strength);             //output signal strength value
          Serial.print('\n');
        }
      }
    }
  }
}
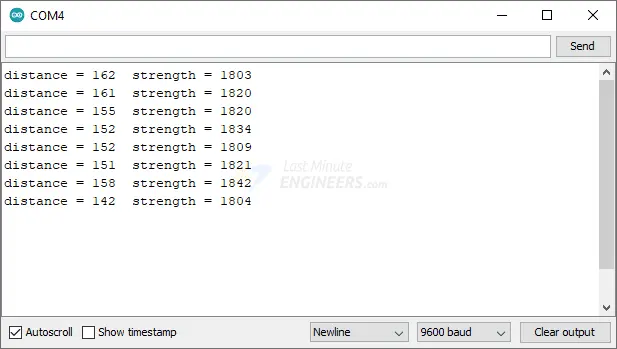
After uploading the sketch, launch your serial monitor, configuring the baud rate to 9600 bps.
Experiment by directing the sensor towards objects in your vicinity. You’ll observe the measured distance streaming on the monitor.
If no information appears, double-check the TFMini-S connection; upon activation, a red light should be visible inside the transmitting lens when viewed from the front.
TFMini Software
The TFMini software stands as a robust tool for testing TFMini sensors. It’s available as a free download but is exclusive to the Windows platform.
You can acquire this program from the official Benewake website.
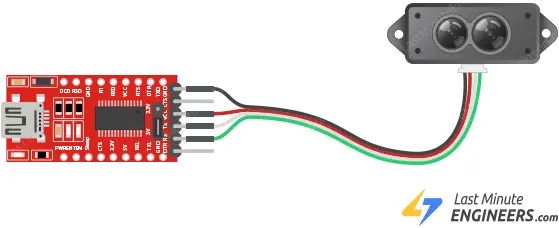
Connecting TFMini to Software
To utilize the TFMini software, link your TFMini-S to your PC via a USB to TTL converter. Ensure that you supply 5V for VCC.
Using TFMini Software
The software itself is distributed as a “Portable” RAR package. Download and extract it to a folder of your preference. Launch the WINCC_TF.exe.
Upon startup, the program interface will appear as illustrated below.
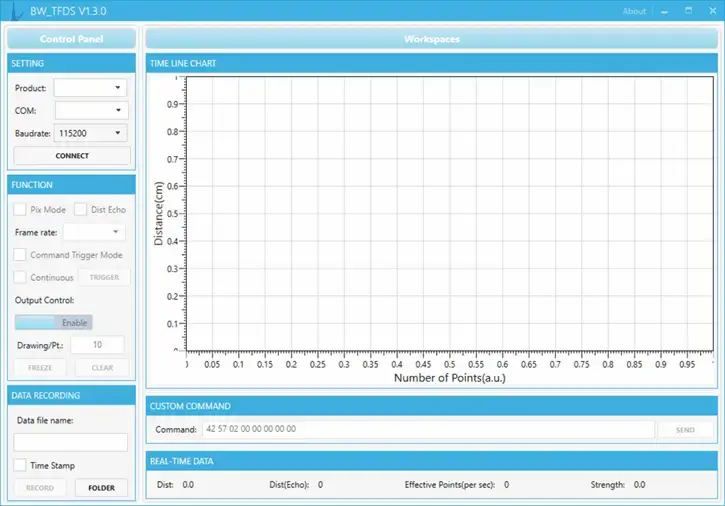
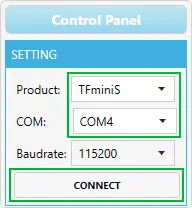
Navigate to the Settings section and opt for TFMiniS as the product type. Then, designate the COM port to which the TFMini-S is attached. Finally, click the Connect button.
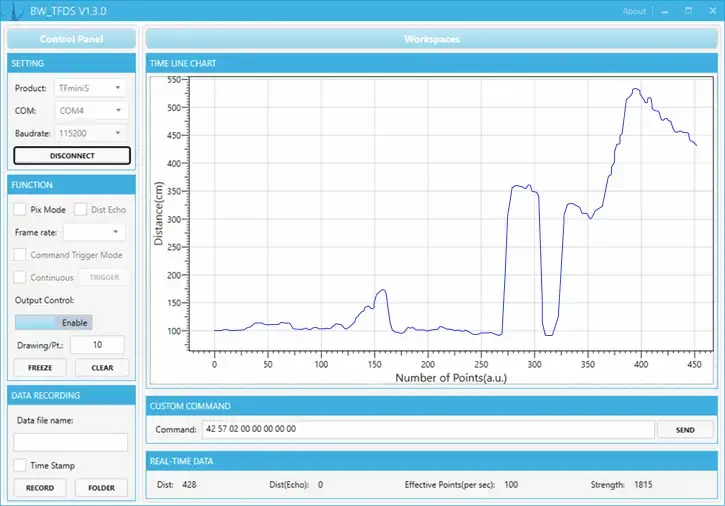
Upon successful connection, the program commences displaying a distance-over-time waveform in the “Time Line Chart” section. Below, in the “Real Time Data” section, you’ll find the current distance (Dist), the count of effective data points per second (Effective Points), and the signal strength (Strength).
Related article
- Understanding Accelerometers: Interface ADXL335 with Arduino
- Arduino Soil NPK Sensor: Maximizing Plant Nutrition
- Step-by-Step: Connecting Reed Switch to Arduino
- Track Heart Rate: A Guide to Pulse Sensor and Arduino Integration
- Using TMP36 Temperature Sensor: Arduino Interfacing Guide