
The Pulse Sensor is an elegantly crafted heart-rate sensor with low power consumption, ideal for use with Arduino. It’s perfect for anyone seeking to integrate live heart-rate data into their projects, including students, artists, athletes, creators, and developers of games and mobile applications.
What’s particularly noteworthy is its seamless integration with Arduino; simply plug it in and attach it effortlessly to a fingertip or earlobe. Additionally, its compact size, resembling a button, and the presence of sewing holes make it convenient for embedding into fabric.
Parts Required
Hardware Overview
At the forefront of the sensor is the area designated for placing your finger, marked with a heart logo. Adjacent to it is a minuscule circular aperture from which the Kingbright’s reverse mounted green LED emits light.
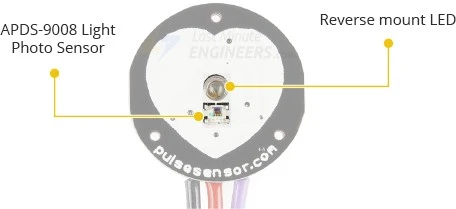
Just below the circular aperture resides a small ambient light photo sensor – the APDS-9008 from Avago. This sensor functions similarly to those found in cell phones, tablets, and laptops, adjusting screen brightness according to ambient lighting conditions.
Situated on the reverse side of the module are components including the MCP6001 Op-Amp from Microchip, along with a selection of resistors and capacitors constituting the R/C filter network. Additionally, a reverse protection diode is incorporated to prevent potential damage in case of accidental reversal of power leads.
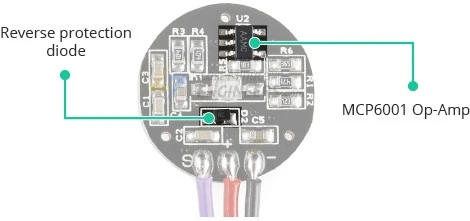
The module operates within a DC power supply range of 3.3 to 5V and consumes less than 4mA of current.
Technical Specifications
The following are the technical specifications:
| Maximum Ratings | VCC | 3.0 – 5.5V |
| IMax (Maximum Current Draw) | < 4mA | |
| VOut (Output Voltage Range) | 0.3V to Vcc | |
| Wavelength | LED Output | 565nm |
| Sensor Input | 525nm | |
| Dimensions | L x W (PCB) | 15.8mm (0.625″) |
| Lead Length | 20cm (7.8″) |
How Does a Pulse Sensor Work?
The principle behind optical heart-rate sensors is quite straightforward. If you’ve ever shone a flashlight through your fingers and observed the pulsation of your heartbeat, you can easily grasp the concept of optical heart-rate pulse sensors.
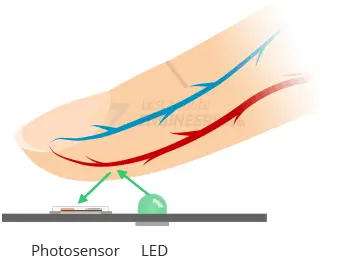
A pulse sensor, like any other optical heart-rate sensor, operates by emitting a green light (~550nm) onto the finger and gauging the quantity of reflected light with a photosensor.
This method of optical pulse detection is termed a Photoplethysmogram.
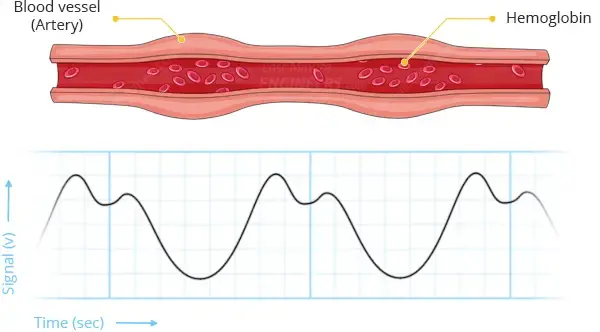
Oxygenated hemoglobin in arterial blood has the property of absorbing green light. The more red the blood (indicating higher hemoglobin levels), the greater the absorption of green light. With each heartbeat, blood flows through the finger, inducing a change in reflected light, thereby generating a waveform at the output of the photosensor.
Continuously illuminating the finger and capturing photosensor readings allows for swift acquisition of a heartbeat pulse reading.
The output signal from the photosensor is typically small and prone to noise; thus, it undergoes filtration via an R/C filter network and subsequent amplification with an Op-Amp, resulting in a significantly larger, cleaner, and more detectable signal.
Pulse Sensor Pinout
The sensor comes with a 24″ flat ribbon cable with three male header connectors. The pinout is shown in the figure below.
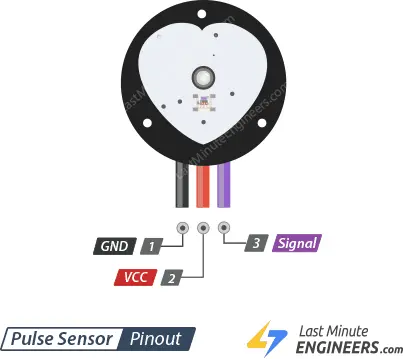
S (Signal) is the signal output. Connects to analog input of an Arduino.
+ (VCC) is the VCC pin. Connects to 3.3 or 5V.
– (GND) is the Ground pin.
Many times, the cable is not color coded, so check the markings on the back of the module to ensure that you have the correct identification of the three wires.
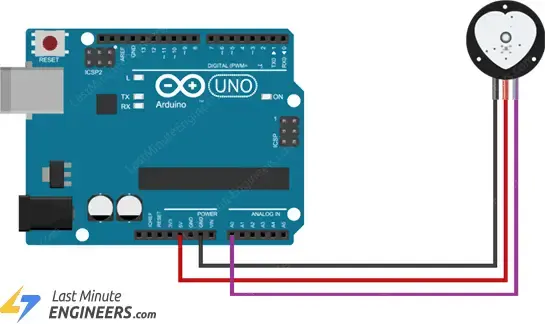
Connecting a Pulse Sensor to an Arduino
Linking the Pulse Sensor to an Arduino is a straightforward task. You’ll only need to connect three wires: two for power and one for reading the sensor value.
The module can be powered with either 3.3V or 5V. Positive voltage is attached to ‘+,’ while ground connects to ‘-.’ The third wire marked ‘S’ is the analog signal output from the sensor, which will be linked to the Arduino’s A0 analog input.
Below is the wiring diagram for Pulse Sensor experiments:
Library Installation
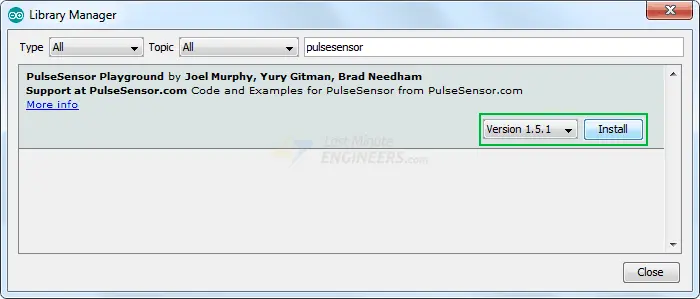
Before running the sketches below, you need to install the ‘PulseSensor Playground’ library.
To install the library, go to Sketch > Include Library > Manage Libraries… Wait for the Library Manager to download the libraries index and update the list of installed libraries.
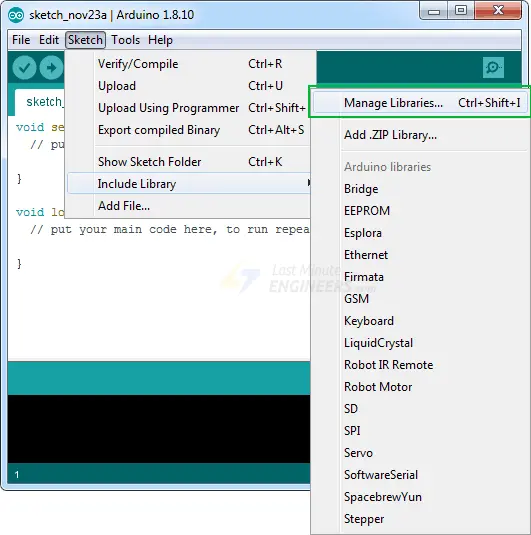
Filter your search by typing ‘pulsesensor’. There should be only one entry. Click on it and then select Install.
PulseSensor Example Sketches
The PulseSensor library contains various example sketches. We’ll discuss a few here, but feel free to experiment with others.
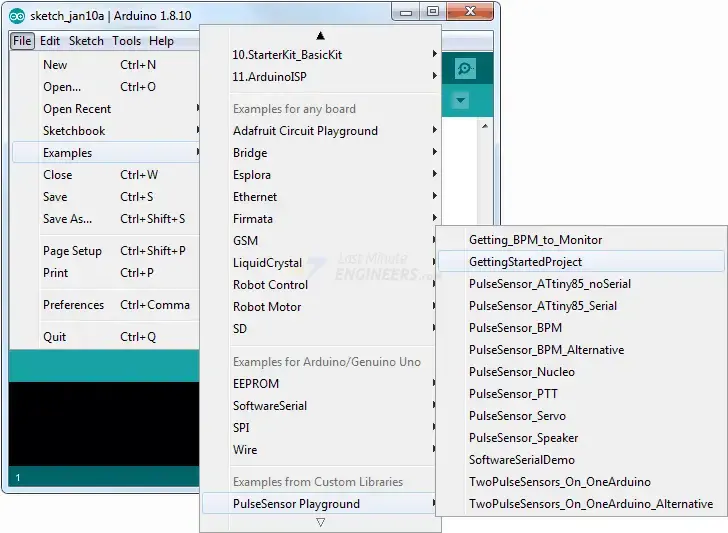
To access the example sketches, go to File > Examples > PulseSensor Playground.
You’ll find a variety of example sketches. You can choose any of them to load the sketch into your IDE. Let’s begin with the GettingStartedProject.
Arduino Example 1 – Heartbeat Blink
Open the GettingStartedProject sketch from the example sketches in your Arduino IDE. This is a simple Arduino sketch. Upload the code to your Arduino board and attach the sensor to your fingertip or earlobe. You will observe the onboard LED of the Arduino blinking in sync with your heartbeat!
int const PULSE_SENSOR_PIN = 0;   // 'S' Signal pin connected to A0

int Signal;                // Store incoming ADC data. Value can range from 0-1024
int Threshold = 550;       // Determine which Signal to "count as a beat" and which to ignore.

void setup() {
	pinMode(LED_BUILTIN,OUTPUT);  // Built-in LED will blink to your heartbeat
	Serial.begin(9600);           // Set comm speed for serial plotter window
}

void loop() {

	Signal = analogRead(PULSE_SENSOR_PIN); // Read the sensor value

	Serial.println(Signal);                // Send the signal value to serial plotter

	if(Signal > Threshold){                // If the signal is above threshold, turn on the LED
		digitalWrite(LED_BUILTIN,HIGH);
	} else {
		digitalWrite(LED_BUILTIN,LOW);     // Else turn off the LED
	}
	delay(10);
}
Code Explanation
The sketch is quite straightforward. It begins by defining the pin used to connect the Pulse Sensor. Additionally, two variables are established: the Signal variable holds the incoming ADC data, while the Threshold variable determines the level at which a signal is considered a “beat” or is disregarded.
int const PULSE_SENSOR_PIN = 0;

int Signal;
int Threshold = 550;
In the setup section, we configure the pin for the onboard LED (pin 13) to function as an output and initialize the serial monitor.
void setup() {
	pinMode(LED_BUILTIN,OUTPUT);
	Serial.begin(9600);
}
Within the loop, we continuously read the analog signal from the Pulse Sensor. If the signal surpasses the predefined threshold value, we activate the onboard LED.
void loop() {
	Signal = analogRead(PULSE_SENSOR_PIN); // Read the sensor value

	if(Signal > Threshold){                // If the signal is above threshold, turn on the LED
		digitalWrite(LED_BUILTIN,HIGH);
	} else {
		digitalWrite(LED_BUILTIN,LOW);     // Else turn off the LED
	}
	delay(10);
}
Having Difficulty Detecting a Heartbeat?
If you’re encountering challenges in observing a heartbeat, here’s what you can do:
- Avoid holding the sensor too tightly, as excessive pressure can expel blood from your fingers, rendering the signal undetectable. Conversely, holding it too loosely may introduce noise from movement and ambient light. Applying moderate pressure, termed the “Sweat Spot,” on the pulse sensor yields a clear, reliable signal.
- Changes in pressure can disrupt blood flow in your finger, leading to inaccurate sensor readings. Aim to maintain consistent pressure by securing the sensor with a rubber band or similar tightening device.
- Experiment with testing the sensor on different parts of your body possessing capillary tissue, such as the earlobe or lower lip.
- Consider adjusting the threshold value. While you have the flexibility to select a threshold value ranging from 0 to 1023, it’s advisable to fine-tune it in increments of 5 or 10. Lowering the threshold enhances sensor sensitivity, while raising it decreases sensitivity. Engage in trial and error with various threshold values until you identify one that provides better results.
Arduino Example 2 – Heartbeat Visualization
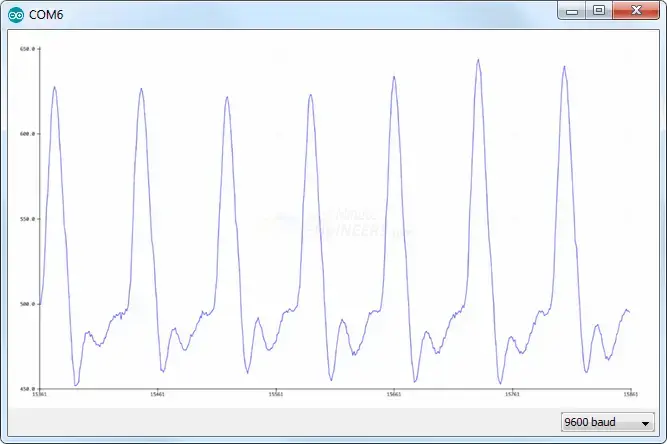
The preceding GettingStartedProject sketch is tailored to function with the Arduino Serial Plotter – a useful tool provided within the Arduino IDE for real-time visualization of analog signals.
While the sketch is executing and your Arduino board is linked to your computer via USB, proceed to Plotter > Serial Plotter.
The signal may require some time to stabilize, but once it does, you should observe a similar pattern.
Feel your wrist pulse and observe the plot replicate the pulsations.
Arduino Example 3 – Heart-Rate Measurement (BPM)
In our third demonstration, we aim to measure heart rate (Beats Per Minute or BPM). Load the Getting_BPM_to_Monitor example from the PulseSensor Playground examples menu into your Arduino IDE.

This sketch calculates the time intervals between pulses to determine the heart rate sensor arduino and displays the result on the Serial Monitor.
#define USE_ARDUINO_INTERRUPTS true // Set-up low-level interrupts for most acurate BPM math
#include <PulseSensorPlayground.h> // Includes the PulseSensorPlayground Library
const int PulseWire = 0; // 'S' Signal pin connected to A0
const int LED13 = 13; // The on-board Arduino LED
int Threshold = 550; // Determine which Signal to "count as a beat" and which to ignore
PulseSensorPlayground pulseSensor; // Creates an object
void setup() {
Serial.begin(9600);
// Configure the PulseSensor object, by assigning our variables to it
pulseSensor.analogInput(PulseWire);
pulseSensor.blinkOnPulse(LED13); // Blink on-board LED with heartbeat
pulseSensor.setThreshold(Threshold);
// Double-check the "pulseSensor" object was created and began seeing a signal
if (pulseSensor.begin()) {
Serial.println("PulseSensor object created!");
}
}
void loop() {
int myBPM = pulseSensor.getBeatsPerMinute(); // Calculates BPM
if (pulseSensor.sawStartOfBeat()) { // Constantly test to see if a beat happened
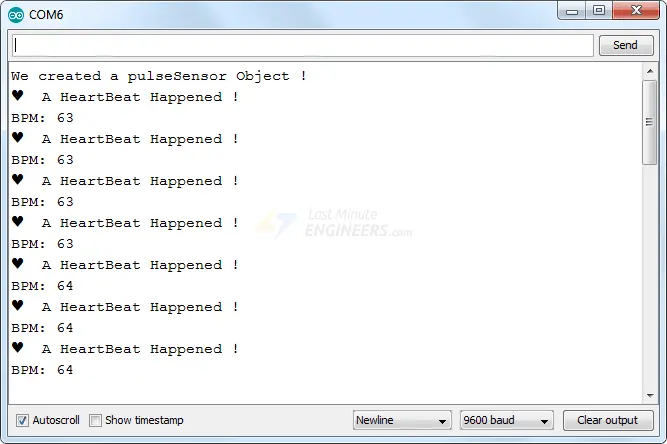
Serial.println("♥ A HeartBeat Happened ! "); // If true, print a message
Serial.print("BPM: ");
Serial.println(myBPM); // Print the BPM value
}
delay(20);
}
The readings may not make immediate sense after uploading the sketch, so try to keep your finger as steady as possible while waiting. You will observe something similar to this on the Serial Monitor.
Processing Visualizer
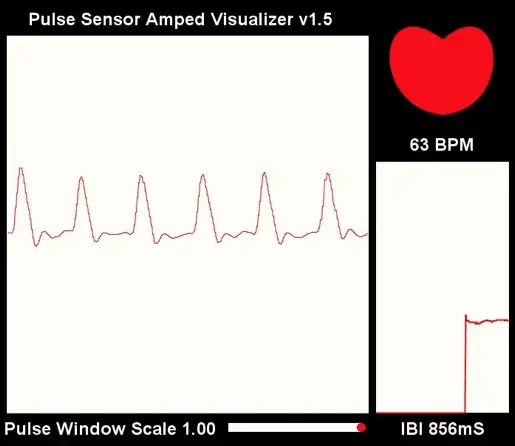
Developers of the Pulse Sensor have created software to visualize Pulse Sensor data on your computer. It’s written in the Processing programming language. This software displays all the data received by the Arduino from the Pulse Sensor. It plots the user’s real-time heart rate sensor arduino and also shows the BPM (Beats Per Minute) while plotting IBI (Interbeat Interval) over time.
This Processing sketch doesn’t perform any calculations! All calculations are done on the Arduino board. To use the visualizer, you need an Arduino running the PulseSensor_BPM sketch. This software simply reads the Serial Port and visualizes the data.
Upload Sketch
Locate PulseSensor_BPM in the File > Examples > PulseSensor Playground examples menu and load it into your Arduino IDE.

Before running the PulseSensor_BPM sketch, you need to change a variable called outputType in the Arduino code to enable your Arduino board to communicate with the visualizer. By default, it’s set to SERIAL_PLOTTER. Change it to PROCESSING_VISUALIZER.
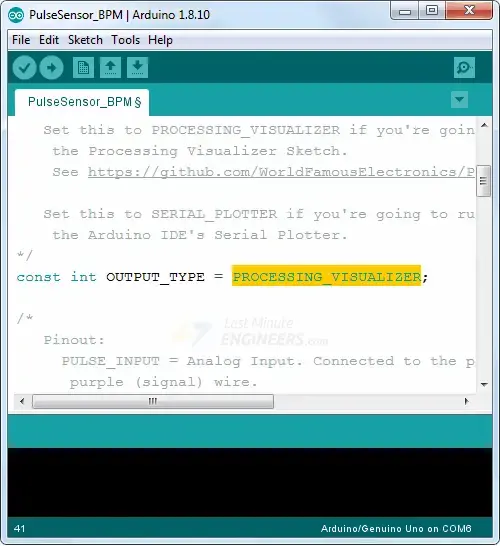
Upload the Arduino Sketch now. Your board should be ready to send data in the format preferred by the Processing Visualizer!
Installation
Download the Processing code from GitHub. Unzip the download and place the PulseSensorAmpd_Processing_Visualizer folder in your Documents/Processing folder.
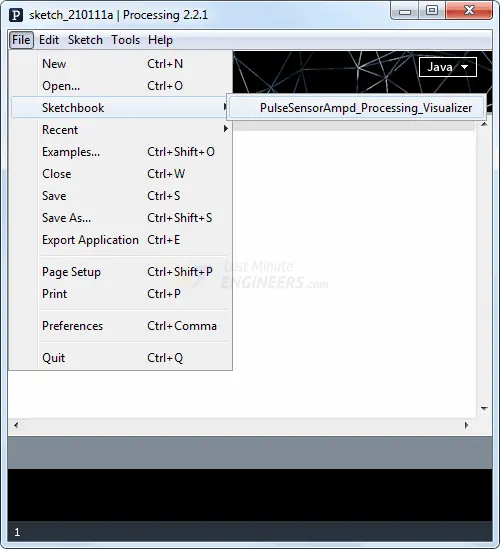
Then, launch Processing to access the code through your Sketch folder. Click on File > Sketchbook…, then choose PulseSensorAmped_Processing_Visualizer.
Setup
Once the Sketch starts, you’ll be prompted to select the USB port to which your Arduino board is connected. If you don’t see your Arduino, use the Refresh Serial Ports button to refresh the ports list.

You will start to see heartbeat data once you select the proper port!
Functions
While the sketch is running, you can perform a few actions:
- Press the ‘s’ key to take a screenshot of the program window. The image will be saved as a .jpg in the sketch folder.
- Press the ‘r’ key to reset the data windows to zero.
Related article
- Arduino DHT11 Sensor Tutorial: How to Interface and Read Data
- Understanding the Operation of HC-SR04 Ultrasonic Sensor and Connecting it to Arduino
- Arduino Water Quality Testing: Utilizing the TDS Sensor
- Voltage Sensor Interfacing with Arduino: Step-by-Step Guide and Code


“A pulse sensor, like any other optical heart-rate sensor, operates by emitting a green light…”
Not true. Very many optical heart-rate sensors have no green LED; they have only red and IR LEDs.
“Applying moderate pressure, termed the ‘Sweat Spot’…”
You may want to edit that line… I think you meant “sweet spot”.
Thank you