

Color sensors offer reliable solutions to intricate automation challenges and find applications across various industries, including food and beverage, automotive, and manufacturing. Their functionalities include material detection, identification of color marks on parts, verification of manufacturing process steps, among other uses.
In industrial settings, high-end color sensors are often employed for their precision. However, for less demanding applications, cost-effective alternatives like the TCS230 color sensor are popular choices.
The TCS230 (also known as TCS3200) color sensor is well-received for its affordability and user-friendly nature. Before integrating this color sensor into Arduino projects, it’s beneficial to grasp the fundamental workings of a color sensor.
How Color Sensors Operate
White light comprises three primary colors—red, green, and blue—with distinct wavelengths. The combination of these colors results in various shades.
When white light interacts with a surface, certain wavelengths are absorbed, and others are reflected based on the surface’s properties. The perceived color is determined by the wavelengths that reflect back into our eyes.

Now, focusing on the sensor, a standard color sensor incorporates a high-intensity white LED that emits modulated light onto the object. To capture the color of the reflected light, most color sensors feature a grid of color-sensitive filters, commonly known as a ‘Bayer Filter,’ along with an array of photodiodes underneath, as depicted in the accompanying image.
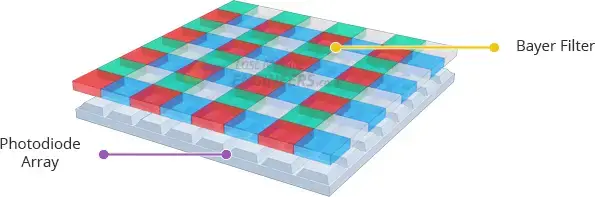
A single pixel consists of four filters: red, blue, green, and a clear filter (no filter). This arrangement is termed the ‘Bayer Pattern.’ Each filter allows only one color to pass through to the underlying photodiode, while the clear filter permits light to pass unchanged, particularly beneficial in low-light conditions.
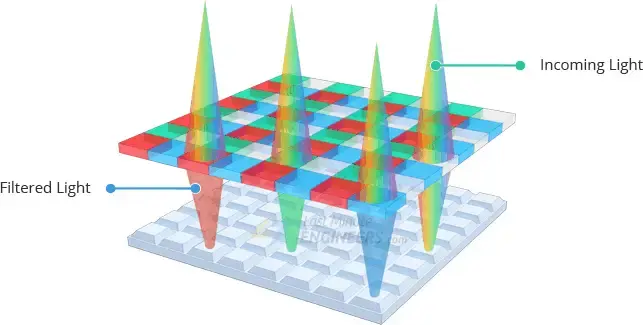
The processing chip then addresses each photodiode individually (one color at a time), measuring the light’s intensity. Since there is a photodiode array, the results are averaged before being sent for processing. Through assessing the relative levels of red, green, and blue light, the object’s color is determined.
TCS230 Color Sensor Module
At the heart of this module lies an economical RGB sensor chip developed by Texas Advanced Optoelectronic Solutions – the TCS230. Serving as a comprehensive color detector, the TCS230 Color Sensor excels in identifying and quantifying a broad spectrum of visible colors.
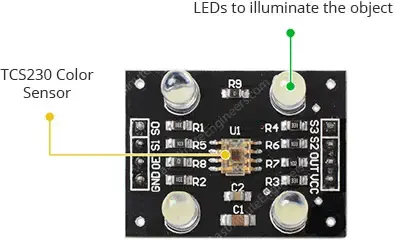
Positioned at the module’s center is the sensor, surrounded by four white LEDs. When the module is powered up, these LEDs illuminate to shed light on the observed object. This feature enables the sensor to function effectively in total darkness, determining the color or brightness of the object.
Operating within a voltage range of 2.7 to 5.5 volts, the TCS230 generates TTL logic-level outputs.
Operation of TCS230
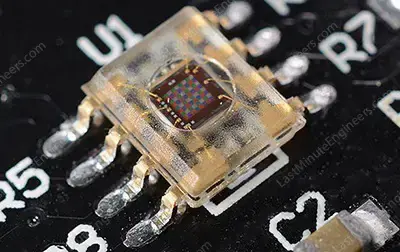
The TCS230 employs an 8 x 8 array of photodiodes to detect colors. Within this array, sixteen photodiodes are equipped with red filters, another sixteen with green filters, sixteen with blue filters, and the remaining sixteen are clear, lacking any filters.
Careful examination of the sensor reveals these distinct filters.
Each set of 16 photodiodes operates in parallel. By manipulating the control pins S2 and S3, one can specify which set of photodiodes to read. For example, selecting only red color involves setting both pins to LOW, as outlined in the provided table.
Different combinations of S2 and S3 facilitate the selection of various photodiode types.
| S2 | S3 | Photodiode type |
| LOW | LOW | Red |
| LOW | HIGH | Blue |
| HIGH | LOW | Clear (No filter) |
| HIGH | HIGH | Green |
An internal current-to-frequency converter transforms photodiode readings into a square wave, where the frequency corresponds to the intensity of the selected color. The typical output frequency range is 2Hz to 500kHz.
Additionally, the sensor incorporates two control pins, S0 and S1, to scale the output frequency. This scaling can be adjusted to three preset values of 2%, 20%, or 100%. The frequency-scaling feature enhances compatibility with various microcontrollers and other devices.
| S0 | S1 | Output frequency scaling |
| LOW | LOW | Power down |
| LOW | HIGH | 2% |
| HIGH | LOW | 20% |
| HIGH | HIGH | 100% |
Various scaling factors can be achieved by altering the combinations of S0 and S1. In Arduino applications, a common choice is the 20% scaling.
TCS230 Color Sensor Module Pinout
The following diagram shows the pinout of a common TCS230 module.
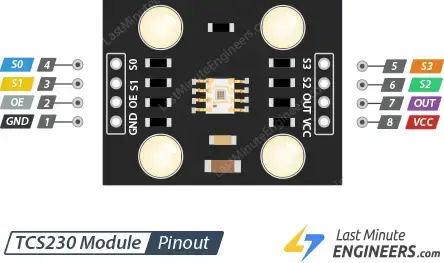
- GND (Ground): Ground pin.
- OE (Output Enable): Output Enable pin. Usually permanently enabled; if not, pull it LOW.
- S0 & S1: Pins used to select the frequency scaling.
- S2 & S3: Pins used to select the color array.
- OUT: TTL level square wave output.
Wiring TCS230 Color Sensor to Arduino UNO
Connecting the TCS230 Color Sensor to an Arduino UNO is straightforward. Every pin on the TCS230 is utilized, except for the Output Enable pin, and the module is powered securely from the 5-volt output of the Arduino.
Here is the wiring setup for experiments with the TCS230:
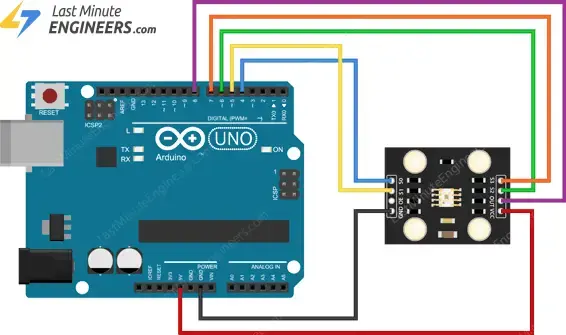
The choice of pins on the Arduino is flexible because the module does not depend on any pin-specific features. If you wish to use different pins, you can do so safely. Ensure that you update the pin numbers in the code to match any changes in the wiring.
Once your sensor is successfully linked to the Arduino, it’s time to start coding!
Parts Required
| Component Name | Buy Now |
| Arduino Uno REV3 | Amazon |
| TCS230 Color Sensor Module | Amazon |
| Breadboard | Amazon |
| BOJACK 1000 Pcs 25 Values Resistor Kit 1 Ohm-1M Ohm with 5% 1/4W | Amazon |
Calibrating the Sensor
To work with the TCS230 color sensor, we will utilize two sketches.
The initial sketch, known as the calibration sketch, aids in obtaining raw data from the sensor. Following this, the second sketch, the main Arduino sketch, utilizes the previously acquired raw data to display RGB values corresponding to the sensed color.
It is important to note that both sketches employ the same hardware setup.
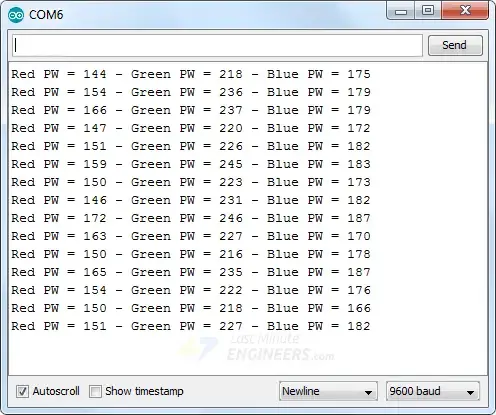
Below is the calibration sketch. This sketch addresses the TCS230 sensor color by color, reading the pulse width of the output pin. The obtained output is then displayed on the serial monitor.
Load the sketch onto your Arduino and position the sensor to face the objects. Begin by identifying reference objects for white and black colors. These reference objects will generate readings at both maximum and minimum values for all three colors.
// Define color sensor pins
#define S0 4
#define S1 5
#define S2 6
#define S3 7
#define sensorOut 8

// Variables for Color Pulse Width Measurements
int redPW = 0;
int greenPW = 0;
int bluePW = 0;

void setup() {
	// Set S0 - S3 as outputs
	pinMode(S0, OUTPUT);
	pinMode(S1, OUTPUT);
	pinMode(S2, OUTPUT);
	pinMode(S3, OUTPUT);

	// Set Pulse Width scaling to 20%
	digitalWrite(S0,HIGH);
	digitalWrite(S1,LOW);

	// Set Sensor output as input
	pinMode(sensorOut, INPUT);

	// Setup Serial Monitor
	Serial.begin(9600);
}

void loop() {
	// Read Red Pulse Width
	redPW = getRedPW();
	// Delay to stabilize sensor
	delay(200);

	// Read Green Pulse Width
	greenPW = getGreenPW();
	// Delay to stabilize sensor
	delay(200);

	// Read Blue Pulse Width
	bluePW = getBluePW();
	// Delay to stabilize sensor
	delay(200);

	// Print output to Serial Monitor
	Serial.print("Red PW = ");
	Serial.print(redPW);
	Serial.print(" - Green PW = ");
	Serial.print(greenPW);
	Serial.print(" - Blue PW = ");
	Serial.println(bluePW);
}


// Function to read Red Pulse Widths
int getRedPW() {
	// Set sensor to read Red only
	digitalWrite(S2,LOW);
	digitalWrite(S3,LOW);
	// Define integer to represent Pulse Width
	int PW;
	// Read the output Pulse Width
	PW = pulseIn(sensorOut, LOW);
	// Return the value
	return PW;
}

// Function to read Green Pulse Widths
int getGreenPW() {
	// Set sensor to read Green only
	digitalWrite(S2,HIGH);
	digitalWrite(S3,HIGH);
	// Define integer to represent Pulse Width
	int PW;
	// Read the output Pulse Width
	PW = pulseIn(sensorOut, LOW);
	// Return the value
	return PW;
}

// Function to read Blue Pulse Widths
int getBluePW() {
	// Set sensor to read Blue only
	digitalWrite(S2,LOW);
	digitalWrite(S3,HIGH);
	// Define integer to represent Pulse Width
	int PW;
	// Read the output Pulse Width
	PW = pulseIn(sensorOut, LOW);
	// Return the value
	return PW;
}
After uploading the sketch, you will receive readings. Record the obtained readings at both extremes.
Code Explanation:
The code begins by defining the pins used to connect the TCS230. Additionally, variables are declared to represent the pulse widths of the red, green, and blue color arrays.
#define S0 4
#define S1 5
#define S2 6
#define S3 7
#define sensorOut 8

int redPW = 0;
int greenPW = 0;
int bluePW = 0;
In the setup section, the S0-S3 pins are set as outputs. These pins are responsible for selecting the frequency scaling and the color to be addressed. S0 and S1 pins are configured to set the frequency scaling to 20%, a commonly used value when interfacing this color sensor with an Arduino. Subsequently, the sensor’s Output pin is defined as an input to the Arduino, where the square wave will be received. Finally, the serial monitor is initialized.
void setup() {
	// Set S0 - S3 as outputs
	pinMode(S0, OUTPUT);
	pinMode(S1, OUTPUT);
	pinMode(S2, OUTPUT);
	pinMode(S3, OUTPUT);

	// Set Pulse Width scaling to 20%
	digitalWrite(S0,HIGH);
	digitalWrite(S1,LOW);

	// Set Sensor output as input
	pinMode(sensorOut, INPUT);

	// Setup Serial Monitor
	Serial.begin(9600);
}
In the loop section, three functions (getRedPW(), getGreenPW(), and getBluePW()) are called to obtain the pulse width values. Let’s take getRedPW() as an example.
The getRedPW() function acquires the red pulse width by setting the S2 and S3 pins to select the red filter. This is the only divergence between this function and its green and blue counterparts.
An integer is then declared to store the pulse width. The pulse width is determined using the Arduino pulseIn() function, configured to measure the width of the LOW part of the pulse. The resulting time in milliseconds is stored in the variable, which is then returned, concluding the function.
int getRedPW() {
	// Set sensor to read Red only
	digitalWrite(S2,LOW);
	digitalWrite(S3,LOW);
	// Define integer to represent Pulse Width
	int PW;
	// Read the output Pulse Width
	PW = pulseIn(sensorOut, LOW);
	// Return the value
	return PW;
}
Back in the loop, the three functions are called to read the color pulse widths, each followed by a delay of 200ms to allow the sensor to stabilize. The obtained values are then printed on the serial monitor, and the loop repeats.
void loop() {
	// Read Red Pulse Width
	redPW = getRedPW();
	// Delay to stabilize sensor
	delay(200);

	// Read Green Pulse Width
	greenPW = getGreenPW();
	// Delay to stabilize sensor
	delay(200);

	// Read Blue Pulse Width
	bluePW = getBluePW();
	// Delay to stabilize sensor
	delay(200);

	// Print output to Serial Monitor
	Serial.print("Red PW = ");
	Serial.print(redPW);
	Serial.print(" - Green PW = ");
	Serial.print(greenPW);
	Serial.print(" - Blue PW = ");
	Serial.println(bluePW);
}
Arduino Code – Reading RGB Values from the TCS230
After obtaining your sensor readings, you can proceed to upload the next sketch, where RGB values will be read from the TCS230 color sensor.
Before uploading the sketch, input the six calibration values acquired from the calibration sketch at the top of the sketch. Replace the placeholder “0” with your actual calibration values.
// Define color sensor pins
#define S0 4
#define S1 5
#define S2 6
#define S3 7
#define sensorOut 8

// Calibration Values
// *Get these from Calibration Sketch
int redMin = 0; // Red minimum value
int redMax = 0; // Red maximum value
int greenMin = 0; // Green minimum value
int greenMax = 0; // Green maximum value
int blueMin = 0; // Blue minimum value
int blueMax = 0; // Blue maximum value

// Variables for Color Pulse Width Measurements
int redPW = 0;
int greenPW = 0;
int bluePW = 0;

// Variables for final Color values
int redValue;
int greenValue;
int blueValue;

void setup() {
	// Set S0 - S3 as outputs
	pinMode(S0, OUTPUT);
	pinMode(S1, OUTPUT);
	pinMode(S2, OUTPUT);
	pinMode(S3, OUTPUT);

	// Set Sensor output as input
	pinMode(sensorOut, INPUT);

	// Set Frequency scaling to 20%
	digitalWrite(S0,HIGH);
	digitalWrite(S1,LOW);

	// Setup Serial Monitor
	Serial.begin(9600);
}

void loop() {
	// Read Red value
	redPW = getRedPW();
	// Map to value from 0-255
	redValue = map(redPW, redMin,redMax,255,0);
	// Delay to stabilize sensor
	delay(200);

	// Read Green value
	greenPW = getGreenPW();
	// Map to value from 0-255
	greenValue = map(greenPW, greenMin,greenMax,255,0);
	// Delay to stabilize sensor
	delay(200);

	// Read Blue value
	bluePW = getBluePW();
	// Map to value from 0-255
	blueValue = map(bluePW, blueMin,blueMax,255,0);
	// Delay to stabilize sensor
	delay(200);

	// Print output to Serial Monitor
	Serial.print("Red = ");
	Serial.print(redValue);
	Serial.print(" - Green = ");
	Serial.print(greenValue);
	Serial.print(" - Blue = ");
	Serial.println(blueValue);
}


// Function to read Red Pulse Widths
int getRedPW() {
	// Set sensor to read Red only
	digitalWrite(S2,LOW);
	digitalWrite(S3,LOW);
	// Define integer to represent Pulse Width
	int PW;
	// Read the output Pulse Width
	PW = pulseIn(sensorOut, LOW);
	// Return the value
	return PW;
}

// Function to read Green Pulse Widths
int getGreenPW() {
	// Set sensor to read Green only
	digitalWrite(S2,HIGH);
	digitalWrite(S3,HIGH);
	// Define integer to represent Pulse Width
	int PW;
	// Read the output Pulse Width
	PW = pulseIn(sensorOut, LOW);
	// Return the value
	return PW;
}

// Function to read Blue Pulse Widths
int getBluePW() {
	// Set sensor to read Blue only
	digitalWrite(S2,LOW);
	digitalWrite(S3,HIGH);
	// Define integer to represent Pulse Width
	int PW;
	// Read the output Pulse Width
	PW = pulseIn(sensorOut, LOW);
	// Return the value
	return PW;
}
Once the sketch is uploaded, observe the results with samples of different colors. Minor adjustments to the calibration values can be made if necessary.
Code Explanation
The majority of this sketch mirrors the previous one, with the key differences outlined below:
Six calibration values from the calibration sketch are entered at the top of the sketch.
// Calibration Values
int redMin = 0; // Red minimum value
int redMax = 0; // Red maximum value
int greenMin = 0; // Green minimum value
int greenMax = 0; // Green maximum value
int blueMin = 0; // Blue minimum value
int blueMax = 0; // Blue maximum value
Three new variables (redValue, greenValue, blueValue) are defined for the RGB values to be output.
int redValue;
int greenValue;
int blueValue;
In the loop section, values are read using the same functions as the previous sketch. The Arduino map() function is then used to convert these values into RGB values, with the calibration values serving as references.
Note that the range has been reversed (Min value is mapped to 255, and Max value is mapped to 0) since the functions return pulse width, not frequency.
// Read Red value
redPW = getRedPW();
// Map to value from 0-255
redValue = map(redPW, redMin,redMax,255,0);
// Delay to stabilize sensor
delay(200);
The final values are printed on the serial monitor, representing the RGB values of the scanned item.
Related article
- Voltage Sensor Interfacing with Arduino: Step-by-Step Guide and Code
- Step-by-Step: Interfacing Multiple DS18B20 Sensors with Arduino
- Interfacing AM2320 Sensor with Arduino: Complete Tutorial
- Arduino Sound Sensor Interface: Control Devices with Clap Detection